

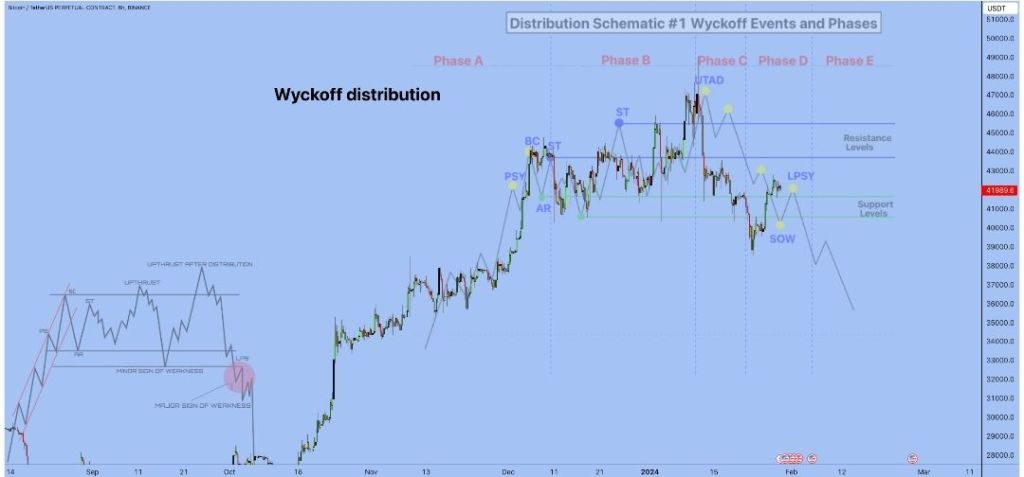
Below is the exact distribution chart
I’ve written a lot about the Wakoff method, now we see one of the most standardized distributions,
but if you open your eyes it’s distribution for some and accumulation for others – now almost every week there are reports that Black Rock has more and more bitcoins – maybe all the bitcoins are just being transferred from other smaller agents. But the bottom line remains the same big players are here and they are going to make a lot of money. The cryptocurrency market is still a small 1.5 TRL $.
In my previous posts with fractals, I stayed with the opinion that we have a blue scenario – LINK
But this is not about fractals
But after analyzing the chart and seeing the wyckoff on it I couldn’t help but share it with you – publishing this post doesn’t mean I believe it, but the correction looks logical – the other question is how exactly it will happen with the renewal of local highs or not.
Below I will show two distributions superimposed on the chart and they are slightly different

Whatever charts they show you on TV or other social networks, follow your trading plan, I buy back altcoins after 30% correction and wait for the final impulsive upward movement without extra passengers. I am not going to short
All these charts are for you to think, and maybe it’s just another horizontal correctional and after , t the upward movement will continue until September 2025.

Leave a comment