
Narratives versus Reality: What Really Drives Bitcoin and Altcoin Prices?
Published: December 25, 2025 | Reading Time: 3 minutes
Crypto markets are frequently explained through compelling narratives. Political developments, regulatory announcements, institutional adoption stories, and cycle-based predictions dominate discussions during periods of high volatility.
While these narratives shape trader positioning and market sentiment, the past year demonstrates that price sustainability depends more heavily on quantifiable factors: capital flows, liquidity conditions, and on-chain behavior rather than headlines alone.
Key Market Insights
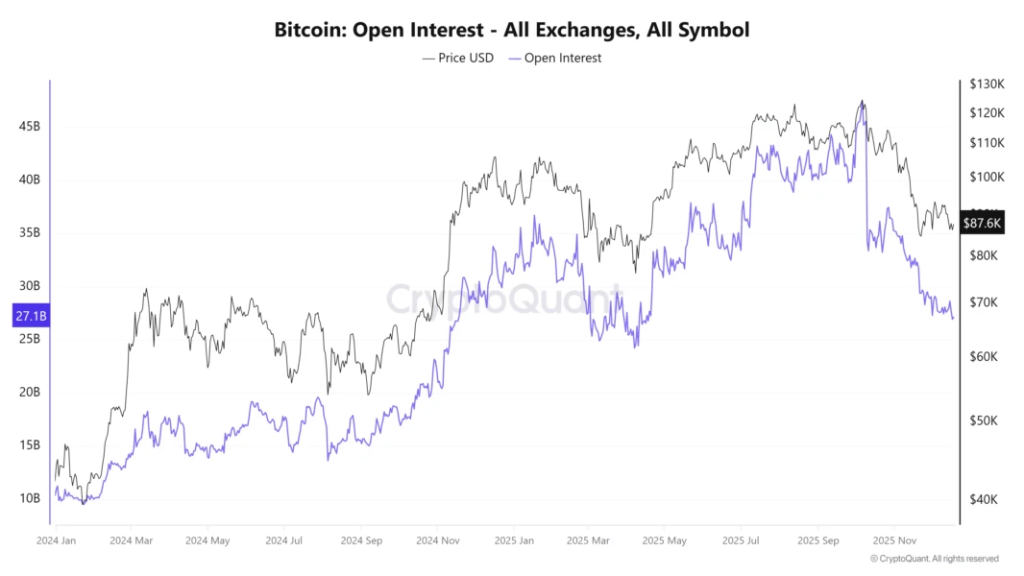
Bitcoin experienced a 56% surge following the US election, driven by a significant increase in futures open interest. However, the rally’s longevity was constrained by insufficient spot market participation.
BTC price movements corresponded closely with spot ETF flow patterns—advancing during periods of sustained inflows and stalling when flows decelerated or reversed. This revealed that ETFs function as demand-sensitive instruments rather than permanent support mechanisms.
A 50% reduction in stablecoin exchange inflows diminished available purchasing power across the market, rendering narrative-driven price movements increasingly vulnerable to reversal.
The Rapid Rise and Fall of Narrative-Driven Rallies
Narratives function primarily as market accelerants rather than fundamental drivers. Political events, particularly shifts toward pro-cryptocurrency leadership, triggered swift repricing in Bitcoin markets throughout 2024, with the US election cycle providing the most prominent example.
Between March and October 2024, Bitcoin remained confined within a $50,000 to $74,000 trading range despite repeated bullish developments. This pattern shifted dramatically in the fourth quarter as markets began pricing in a potential Trump election victory. During the week preceding the November 4 election results, Bitcoin retraced approximately 8% as traders reduced risk exposure. Following the confirmed outcome, BTC surged 56% over the subsequent 42 days, breaking through the $100,000 threshold.
This price movement coincided with substantial expansion in futures market positioning, with open interest nearly doubling during Q4 after remaining relatively stable throughout most of the year. Despite this, follow-through proved limited.
Even after establishing new all-time highs, Bitcoin struggled to maintain upward momentum. Spot market demand failed to match the pace of leveraged positioning, leaving the market exposed once trader positioning became overcrowded. The key lesson is not that narratives lack relevance, but rather that they primarily influence positioning dynamics instead of actual capital deployment.
Spot ETF Flows Demonstrate Authentic Demand
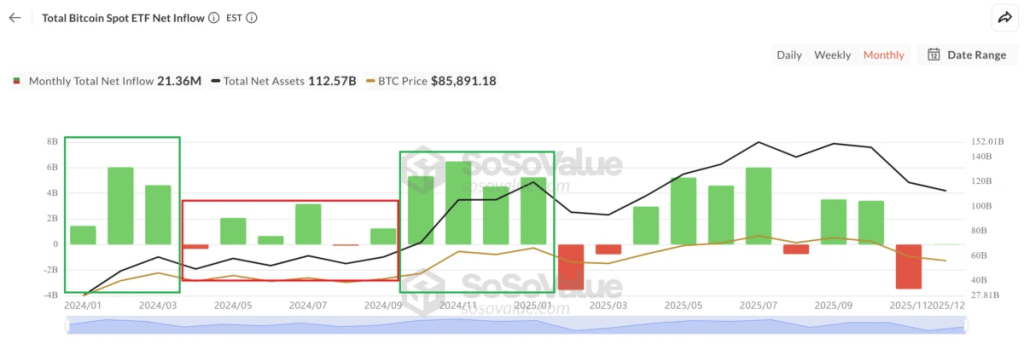
Spot Bitcoin ETFs emerged as one of the few catalysts where narrative expectations aligned with measurable data. US spot ETFs recorded approximately $35 billion in net inflows during 2024, followed by roughly $22 billion in 2025.
Bitcoin price action tracked these flows with remarkable consistency. During Q1 2024, over $13 billion in inflows corresponded with Bitcoin’s advance from $42,000 to $73,000. As inflows decelerated after Q1, Bitcoin entered an extended consolidation phase lasting through October. This relationship re-emerged in late 2024, when nearly $22 billion in inflows between October and January accompanied the move from $70,000 to $102,000.
Conversely, during market drawdowns, ETF flows occasionally turned negative, demonstrating these vehicles were not functioning as buyers of last resort. The conclusion is that spot ETFs matter because they convert narrative into quantifiable demand, but only while inflows remain consistent. When flows diminish, price momentum likewise fades.
Liquidity Remains the Dominant Variable
Liquidity, specifically deployable capital, represents one of the most transparent drivers of price behavior. Stablecoin exchange inflows serve as an effective proxy for available buying capacity.
When stablecoin inflows increase, markets can absorb selling pressure and sustain trending movements, as observed during Q4 2024 through Q1 2025. When inflows contract, rallies become fragile and vulnerable. From recent peak levels, stablecoin inflows declined by approximately 50%, indicating substantially reduced buying capacity.
In lower-liquidity environments, narrative-driven rallies typically fade rapidly. Prices can still respond to narratives or positioning shifts, but without incremental capital entering the market, breakouts struggle to extend, and corrections become increasingly probable.
Macro Factors and On-Chain Dynamics
The failure of bullish narratives to sustain price appreciation in 2025 is further explained by broader allocation dynamics and on-chain supply patterns. The Bitcoin-to-gold ratio declined from roughly 40 ounces per BTC in December 2024 to approximately 20 ounces by Q4 2025, reflecting a rotation toward defensive assets amid elevated real yields of 1.8% in Q2.
Simultaneously, on-chain data revealed persistent distribution activity. Long-term holders realized over $1 billion per day in profits on a seven-day average basis during July, marking one of the most significant profit-taking phases in Bitcoin’s history.

Elevated real yields, increased correlation with equity markets, and sustained selling from long-term holders collectively raised Bitcoin’s opportunity cost and constrained price expansion throughout the second half of 2025.
Conclusion: Capital Over Headlines
The past year established one principle with clarity: narratives move prices, but liquidity moves markets. Headlines generate urgency and volatility, but sustainable trends require actual capital deployment, improving macroeconomic conditions, and spot-led demand.
Disclaimer: This article does not contain investment advice or recommendations. Every investment and trading decision involves risk, and readers should conduct their own research before making decisions. While we strive to provide accurate and timely information, we do not guarantee the accuracy, completeness, or reliability of any information in this article. This article may contain forward-looking statements that are subject to risks and uncertainties. We will not be liable for any loss or damage arising from your reliance on this information.

Leave a comment